Provision ClickHouse Cloud, dual-write through OpenTelemetry, validate parity, explore ClickStack, and cut over.
Run this module from the workshop artifact directory:
cd "$(git rev-parse --show-toplevel)/workshops/elasticsearch_migration_lab/part3"
Objective: Execute the migration plan you developed in Part 2. Deploy an OTel Collector, create optimized ClickHouse tables, configure enrichment via dictionaries, validate parity with the running Elasticsearch environment, then cut over.
Estimated time: 120–180 minutes
Prerequisites: Parts 1 and 2 complete; the Part 1 Docker environment is running (Elasticsearch, Kibana, log generators, APM Server). Your ClickHouse Cloud account credentials are available.
Files:
part3/├── exercises/│ ├── setup-checklist.md ← Fill in as you work through each step│ └── sql-exercises.md ← 6 SQL exercises (attempt before checking solutions)├── clickhouse/│ ├── schema.sql ← All DDL (run first)│ ├── dictionaries.sql ← GeoIP dictionary DDL│ ├── geoip-sample-data.csv ← ~400 CIDR rows (no MaxMind account needed)│ ├── alert-tables.sql ← Alert pre-computation + summary MVs│ └── validation-queries.sql ← Spot-checks and parity queries├── configs/│ ├── otel-collector-config.parallel.yaml ← File-based log collector — parallel run (CH + ES dual-write)│ ├── otel-collector-config.cutover.yaml ← File-based log collector — cutover (CH only)│ ├── otelcol-demo-config.parallel.yml ← OTel Demo collector — parallel run (APM + CH)│ └── otelcol-demo-config.cutover.yml ← OTel Demo collector — cutover (CH only)├── docker/│ ├── docker-compose.otel-demo.parallel.yml ← Compose override for parallel-run swap│ └── docker-compose.otel-demo.cutover.yml ← Compose override for cutover swap├── diagrams/│ ├── step3-architecture.mmd ← Mermaid source — post-Step-3 architecture│ ├── step3-architecture.png ← Rendered PNG embedded in Step 3│ └── render.sh ← Re-render *.mmd → *.png via Docker (mermaid-cli)├── images/│ └── *.png ← Screenshots referenced by hyperdx-guide.md└── scripts/ ├── swap-otelcol-demo-config.sh ← Swap otelcol-demo config (parallel|cutover) ├── validate_migration.sh ← Automated parity check └── validate_enrichment.sh ← Enrichment column verification
ClickHouse Cloud architecture note: Unlike Elasticsearch, ClickHouse Cloud stores all data on object storage (S3/GCS) with automatic local caching. There is no concept of hot/warm/cold node tiers — the query engine fetches and caches data transparently. This means the entire ES ILM hot→warm→cold machinery has no equivalent in ClickHouse Cloud. You only need TTL-based deletion, which you'll configure in Step 2.
Set environment variables for the rest of the lab:
# Copy and fill in once, then source before every sessioncp ../common/env.sh.example ../common/env.sh# edit ../common/env.sh with your CH_HOST and CH_PASSWORD (from Cloud console → Connect → Native protocol)source ../common/env.sh
Database: All Part 3 objects (tables, dictionaries, materialized views) live in a dedicated otel database — created automatically by dictionaries.sql and schema.sql via CREATE DATABASE IF NOT EXISTS otel. This keeps the lab's tables isolated from anything else in your service. Every collector config, validation script, and HyperDX source in this part is pre-configured to point at otel.
Run order: GeoIP dictionaries (Step 2a) must be created before the target tables (Step 2b) because otel_logs_v2 has MATERIALIZED columns that reference otel.geoip_country and otel.geoip_city. ClickHouse validates dictionary references at CREATE TABLE time.
# 1. Create the otel database, geoip_data source table, and empty dictionaries# (the table must exist before you can INSERT into it)clickhouse client \ --host ${CH_HOST} --port 9440 \ --user default --password ${CH_PASSWORD} --secure \ < clickhouse/dictionaries.sql# 2. Load sample data into the source table (note: --database otel)clickhouse client \ --host ${CH_HOST} --port 9440 \ --user default --password ${CH_PASSWORD} --secure \ --database otel \ --query "INSERT INTO geoip_data FORMAT CSVWithNames" \ < clickhouse/geoip-sample-data.csv# 3. Reload dictionaries — they were created with an empty table; force reload nowclickhouse client \ --host ${CH_HOST} --port 9440 \ --user default --password ${CH_PASSWORD} --secure \ --query "SYSTEM RELOAD DICTIONARY otel.geoip_country"clickhouse client \ --host ${CH_HOST} --port 9440 \ --user default --password ${CH_PASSWORD} --secure \ --query "SYSTEM RELOAD DICTIONARY otel.geoip_city"# 4. Verifyclickhouse client \ --host ${CH_HOST} --port 9440 \ --user default --password ${CH_PASSWORD} --secure \ --query "SELECT dictGet('otel.geoip_country', 'country', toIPv4('8.8.8.8'))"# Expected: United States
Teaching point: In Elasticsearch, the geoip processor is a built-in black box — you enable it and it works. In ClickHouse, you use a dictionary backed by the same MaxMind data, giving you full control over the data source, refresh interval, and lookup behavior. The IP_TRIE layout is purpose-built for CIDR range lookups: dictGet() performs a longest-prefix match over the IP range table in microseconds.
Where data actually lives, with enrichment columns
otel_logs_mv
Materialized View
Routes otel_logs → otel_logs_v2 with transformations
otel_traces
MergeTree
OTel trace spans
otel_metrics_gauge
MergeTree
OTel gauge metrics (replaces APM server as metrics backend)
otel_metrics_sum
MergeTree
OTel sum/counter metrics
otel_metrics_histogram
MergeTree
OTel histogram metrics
otel_metrics_exponentialhistogram
MergeTree
OTel exponential histogram metrics
otel_metrics_summary
MergeTree
OTel summary metrics
Why the Null → MV → target pattern?
The Null engine accepts inserts but discards the data immediately. The attached MV fires on every insert and writes transformed rows to otel_logs_v2. This avoids storing data twice: the OTel Collector writes raw OTel schema to otel_logs, and only the enriched, optimized rows land in otel_logs_v2.
Materialized columns replace every ES ingest pipeline processor:
ES processor
ClickHouse equivalent
geoip
GeoCountry, GeoCity MATERIALIZED via dictGetOrDefault('otel.geoip_country', ...)
user_agent
BrowserFamily, OSFamily, IsBot MATERIALIZED via regexpExtract / position
script (severity derivation)
DerivedSeverity MATERIALIZED via multiIf(StatusCode >= 500, 'critical', ...)
grok/dissect (field extraction)
RequestType, RequestPath, RequestPage, HostName MATERIALIZED from LogAttributes['key']
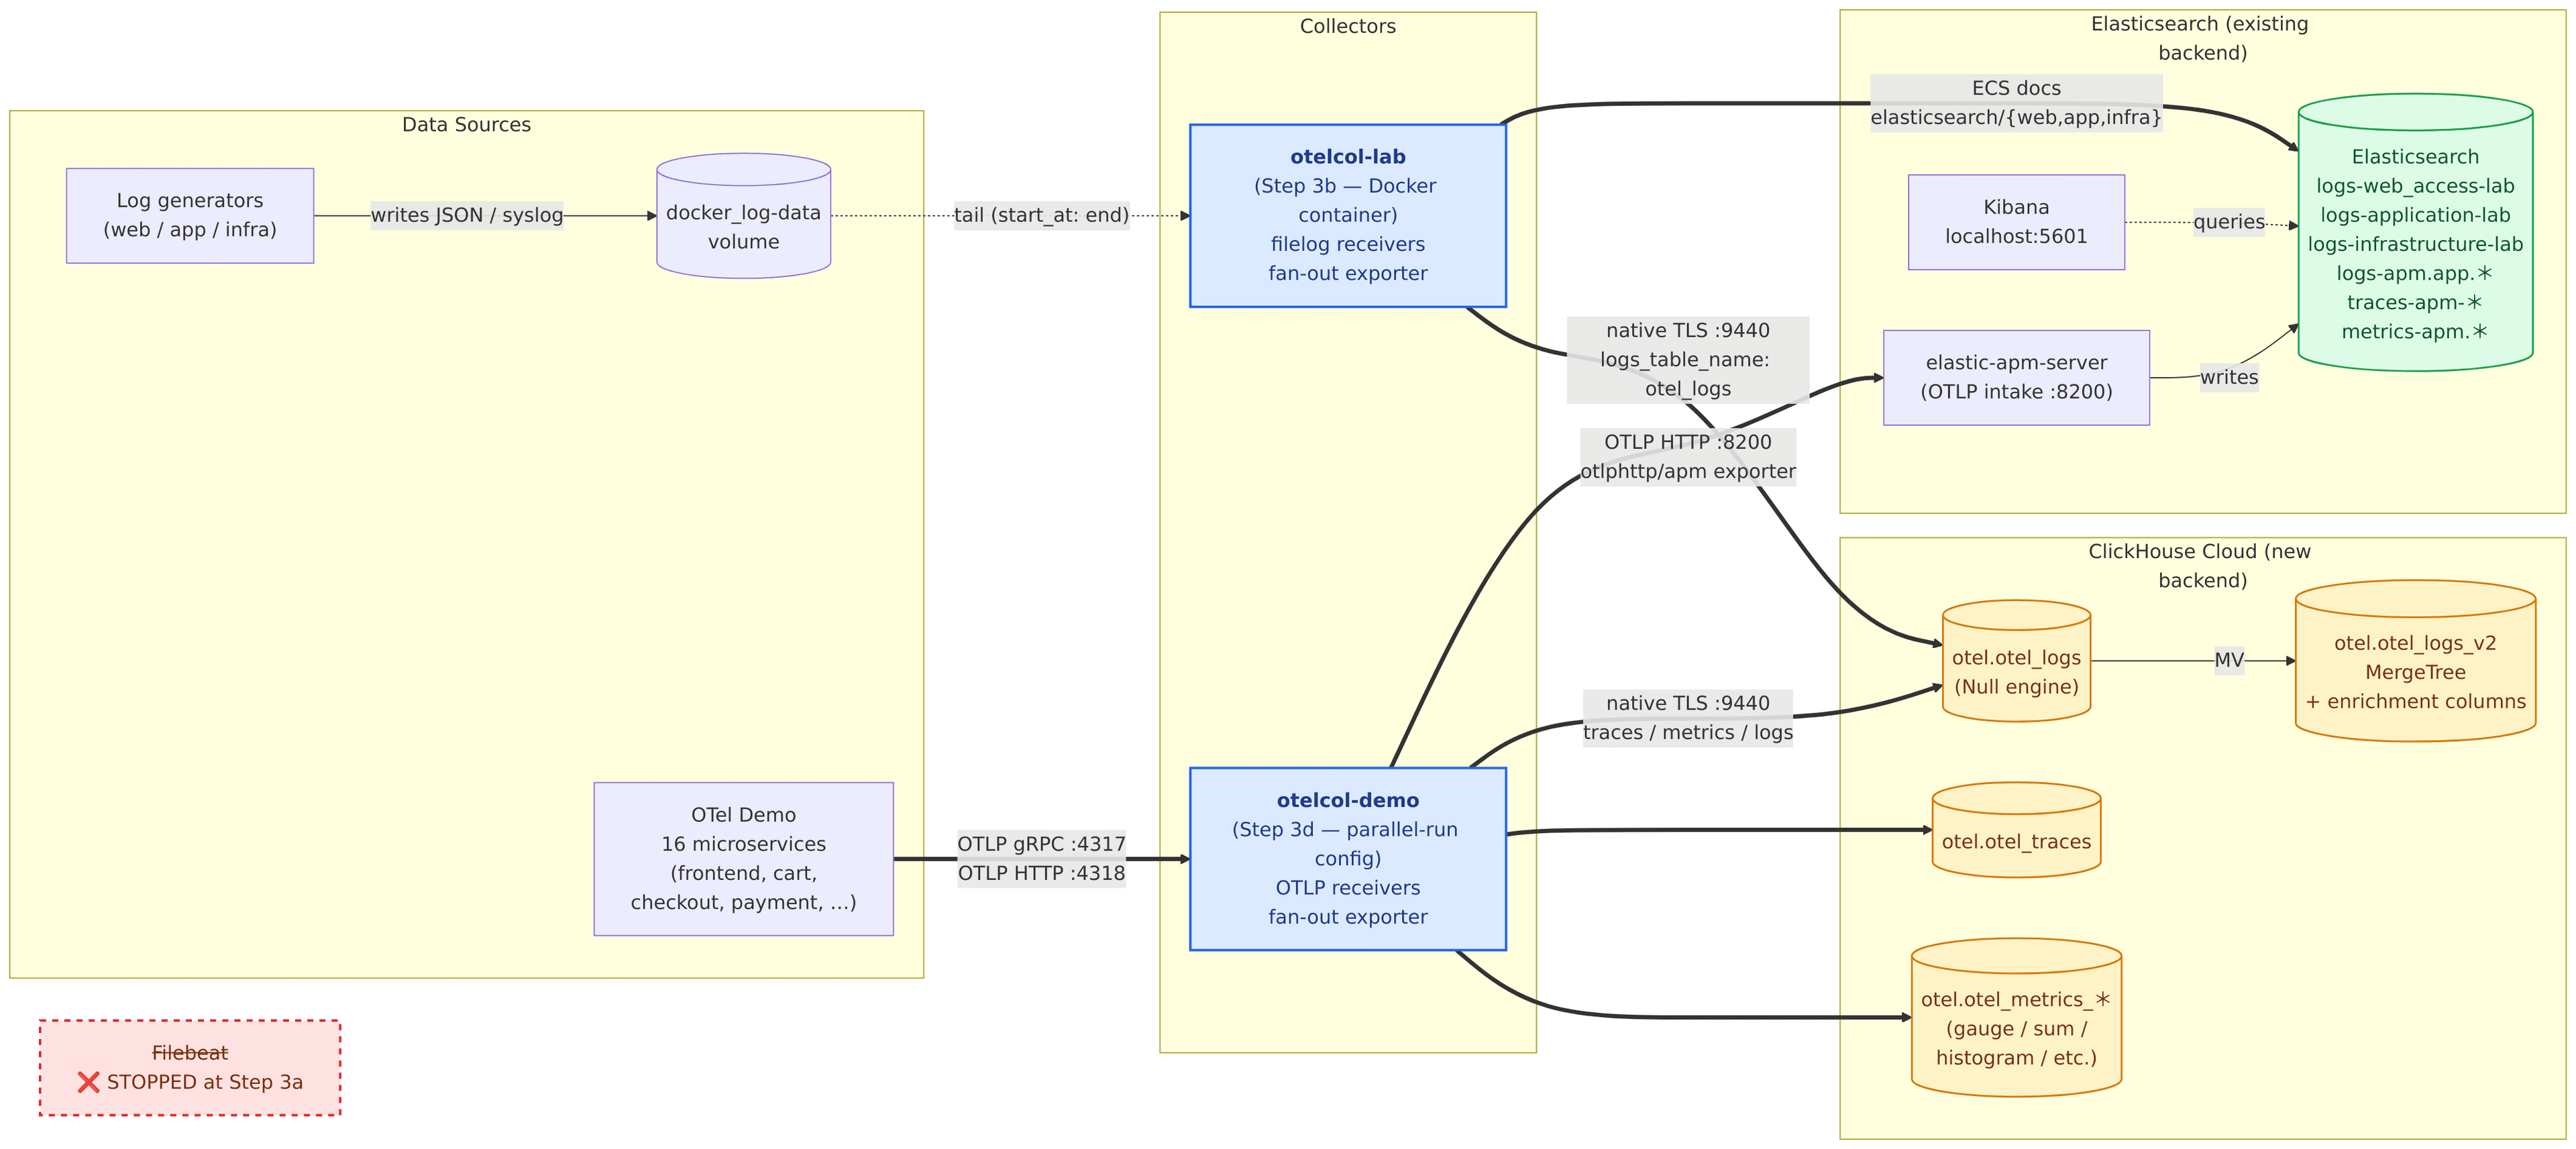
By the end of this step, you will have transitioned from the Part 1 baseline (Filebeat → ES, otelcol-demo → APM only) to a parallel run in which two OTel Collectors fan out every signal to both the existing Elasticsearch stack and ClickHouse Cloud:
What changes in this step:
3a: stop Filebeat (in red, lower-left in the diagram).
3b–3c: start otelcol-lab (file-based collector) — tails the same log files Filebeat used to read, and dual-writes to ES (logs-{web_access,application,infrastructure}-lab) and ClickHouse (otel.otel_logs → MV → otel.otel_logs_v2).
3d: swap otelcol-demo to its parallel-run config so the 16 OTel Demo services' OTLP traffic also fans out to both backends (APM Server + ClickHouse).
Diagram source: diagrams/step3-architecture.mmd. To re-render after edits, run bash diagrams/render.sh (uses minlag/mermaid-cli via Docker, no Node/npm required).
The OTel Collector you're about to start tails the same log files Filebeat is tailing and writes to the same ES data streams (logs-web_access-lab, logs-application-lab, logs-infrastructure-lab) as well as ClickHouse. If both Filebeat and the OTel Collector are running, every log line gets indexed twice in ES — the literal "dual-write to the same destination" problem.
Stop Filebeat so the OTel Collector becomes the single producer for those data streams:
Elasticsearch, Kibana, log generators, and APM Server remain running. Only Filebeat stops. The OTel Collector takes over both backends: it ships every log line to ClickHouse (the new backend) and to Elasticsearch (the existing data streams), so parity comparisons remain meaningful throughout the parallel run. At cutover (Step 10a), the ES exporters get removed from the config.
The log files live inside the Docker named volume docker_log-data. On macOS (and any environment where log files are inside Docker volumes), run the collector as a Docker container so it can access that volume directly:
Note on dial_timeout: Both otel-collector-config.parallel.yaml and otel-collector-config.cutover.yaml set dial_timeout=60s on the ClickHouse endpoint URI to give the cold-start handshake enough time before the first restart kicks in. If you're on a self-hosted CH where startup is instant, you can lower this back to 10s.
Linux host with direct volume access: If you are running on Linux and have direct access to the log files on the host (not inside Docker volumes), you can use the binary instead:
Dual-write fan-out: every pipeline lists [clickhouse, elasticsearch/<stream>] so each log line is shipped to both backends during the parallel run. Step 10a removes the ES exporters at cutover.
One ES exporter per data stream (elasticsearch/web → logs-web_access-lab, elasticsearch/app → logs-application-lab, elasticsearch/infra → logs-infrastructure-lab) so each pipeline writes to the same data stream Filebeat was previously writing to.
mapping.mode: ecs on the ES exporters — converts OTel-format records (Body, Attributes, ...) to ECS-shaped documents that match what Filebeat used to send, so the data stream's component templates accept them.
create_schema: false on the CH exporter — we already created our own optimized tables; don't let the exporter create its default schema.
logs_table_name: otel_logs — writes to the Null table, which triggers the MV to otel_logs_v2.
compress=lz4 in the CH endpoint — LZ4 compression over the wire; ClickHouse Cloud decompresses on receipt.
Note: The lab collector deployed above handles only file-based logs (web/app/infra). The 16 OTel Demo services emit OTLP into a second collector (otelcol-demo) that was provisioned in Part 1 and currently forwards everything to APM Server. Step 3d below swaps it to a dual-write config without editing the Part 1 baseline file.
The otelcol-demo container started in Part 1 forwards OTLP traces/metrics/logs to APM Server only. To run in parallel, swap it to a Part 3 config that fans out to both APM and ClickHouse:
source ../common/env.sh # CH_HOST, CH_PASSWORD must be setbash scripts/swap-otelcol-demo-config.sh parallel
This recreates the container using docker compose -f ... -f docker/docker-compose.otel-demo.parallel.yml up -d --force-recreate --no-deps otelcol-demo. The Part 1 config file is not modified — the override mounts a Part 3 config at a different container path and overrides command: to load it.
Verify it started cleanly:
docker logs "$(docker ps -qf name=otelcol-demo)" --tail=10# Expected: "Everything is ready. Begin running and processing data."# No "Failed to start component" or "connection refused" errors.
Why a swap instead of editing the Part 1 file in place? Editing part1/docker/configs/otelcol-demo-config.yml directly would mutate the baseline, so a future cleanup.sh && start from Part 1 lands you on a config that already requires CH_HOST/CH_PASSWORD. The swap pattern keeps Part 1 self-contained and reproducible.
HyperDX is the built-in observability UI for ClickStack — bundled with every ClickHouse Cloud service. In this step you'll launch HyperDX, wire it to the otel database, and confirm logs / traces / metrics are queryable through the UI.
→ Follow the step-by-step guide with screenshots: hyperdx-guide.md
The guide covers:
A. Launch ClickStack
Open HyperDX from the Cloud console sidebar
B. Create three data sources
Bind HyperDX to otel.otel_traces, otel.otel_logs_v2, and the five otel.otel_metrics_* tables
C. Search live logs
Confirm data is flowing, use facets and full-text search
D. Build a chart with the AI Assistant
Translate natural language ("Error count by services for past 2 hours") into a working chart
Teaching point: HyperDX's Service Map, full-text search, and AI Assistant all run directly against the otel.* MergeTree tables — no separate index, no rollups, no resharding. The same operational use cases you covered in the Kibana dashboards from Part 1 are available here, but the underlying queries can also be written ad-hoc as SQL (see Step 9 SQL exercises) — something Kibana never offered.
TTL is already configured in the schema.sql DDL. Verify it's in place:
SELECT name, extractAll(create_table_query, 'TTL[^\\n]+') AS ttl_clausesFROM system.tablesWHERE database = 'otel' AND name IN ('otel_logs_v2', 'otel_traces', 'otel_metrics_gauge', 'otel_metrics_sum', 'otel_metrics_histogram', 'otel_metrics_exponentialhistogram', 'otel_metrics_summary');
Check partition sizes and age:
SELECT partition, sum(rows) AS total_rows, formatReadableSize(sum(bytes_on_disk)) AS disk_size, min(min_time) AS oldest_data, max(max_time) AS newest_dataFROM system.partsWHERE database = 'otel' AND table = 'otel_logs_v2' AND activeGROUP BY partitionORDER BY partition;
Teaching point: Why ILM becomes one line of DDL
In Part 1, you configured a 3-phase ILM policy: rollover at 5GB/1d (hot), shrink + forcemerge at 2d (warm), delete at 30d. This required hot/warm node roles, shard allocation awareness, and ILM policy JSON.
In ClickHouse Cloud, the entire machinery collapses to one clause in the CREATE TABLE:
TTL TimestampDate + INTERVAL 30 DAY DELETESETTINGS ttl_only_drop_parts = 1
Rollover: Not needed. ClickHouse uses a single table with date-based partitions.
Warm phase (shrink + forcemerge): Not needed. The MergeTree engine merges parts automatically.
Hot/warm/cold tiering: Not needed. ClickHouse Cloud stores all data on object storage with automatic caching. There are no node roles.
Delete phase: Replicated exactly by TTL ... DELETE. ttl_only_drop_parts = 1 drops entire partitions (the partition boundary is one day) — far more efficient than row-by-row deletion.
The logs_summary_1min table (created in Step 2c) is an AggregatingMergeTree that stores partial aggregation states. Query it with -Merge combinators:
SELECT minute, ServiceName, SeverityText, countMerge(count) AS total_events, avgMerge(avg_run_time) AS avg_run_time_ms, quantileMerge(0.99)(p99_run_time) AS p99_run_time_ms, uniqMerge(uniq_remote_addr) AS unique_ipsFROM logs_summary_1minWHERE minute >= now() - INTERVAL 1 HOURGROUP BY minute, ServiceName, SeverityTextORDER BY minute DESC;
Teaching point: State / Merge combinator pattern
The summary table stores partial aggregation states, not final values. countState() stores a serialized partial count; avgState() stores the sum + count needed to compute an average. When you query with countMerge(), ClickHouse combines the partial states and computes the final value.
This is the key difference from Elasticsearch transforms: ES transforms re-aggregate raw data periodically. ClickHouse's AggregatingMergeTree accumulates new data incrementally without ever re-reading historical records — fundamentally more efficient at scale.
HyperDX has a built-in Alerts view (left sidebar — between Chart Explorer and Client Sessions). Alerts attach to saved searches or chart tiles: you define a query, a threshold, an evaluation window, and a notification channel. Because the data sources you set up in Step 5 already point at the otel database, no additional plumbing is required.
For the exact UI flow, follow the official docs:ClickStack Alerts — clickhouse.com/docs. Use the table below for the two alerts this lab calls for; the docs walk you through Save Search → Create Alert → Configure threshold → Notify for each one.
#
Alert name
HyperDX source
Search criteria (paste into Search bar before saving)
Alert condition
Window
Replaces Kibana rule
1
web-5xx-errors
log
RequestType:* AND StatusCode:>=500
count() > 0 (absolute) — fires on any 5xx in the window. For a rate threshold instead, build a chart whose Y-axis is countIf(StatusCode >= 500) / count() and alert when value > 0.05.
5 minutes, evaluated every 1 minute
"5xx rate > 5% over 5 minutes"
2
heartbeat-<service>
log
ServiceName:"<service-name>" (one saved search per service you care about, e.g. payment-service, order-service)
count() == 0 — fires when the saved search returns zero rows over the window
3 minutes, evaluated every 1 minute
"Service went silent for 3+ minutes"
Heads-up on alert #2: HyperDX's saved-search alerts evaluate one query, so per-service silence detection requires one saved search + alert per service. For more than ~5 services, Option B below (SQL NOT IN pattern in a single MV) is the better fit.
The alert_error_rate table and alert_error_rate_mv (created in Step 2c) pre-compute the 5xx rate at insert time. An external poller checks the tiny pre-aggregated table instead of scanning millions of raw rows:
-- Poll this every 1 minute (via cron or any scheduler)SELECT minute, error_rateFROM alert_error_rateWHERE minute >= now() - INTERVAL 5 MINUTE AND error_rate > 0.05ORDER BY minute DESC;
If this query returns any rows, the alert fires.
Teaching point: Elasticsearch's alerting re-aggregates raw data on every check interval. The MV-based approach shifts the expensive aggregation to insert time — the alert poll query scans a tiny table with ~1 row/minute, not millions of raw log rows.
The lab ships with a dedicated configs/otel-collector-config.cutover.yaml that drops the three ES exporters and leaves ClickHouse as the sole destination. Recreate the otelcol-lab container with that file mounted instead of the parallel-run one — no in-place edits required:
All ClickHouse checks should still pass. The ES count checks will fail (expected — ES is no longer receiving data), so confirm the ClickHouse counts are still growing.
After Step 10d stops elastic-apm-server, the OTel Demo collector's APM exporter starts logging queue-full errors and back-pressures the entire pipeline — including the ClickHouse exporter that fans out alongside it. Swap to a cutover config that has no APM exporter:
This mounts configs/otelcol-demo-config.cutover.yml (ClickHouse-only) and recreates the container. The Part 1 baseline file remains untouched, so a fresh cleanup.sh && start from Part 1 always lands on a clean APM-only state.
Verify metrics are flowing to ClickHouse:
SELECT table, count() AS rowsFROM system.partsWHERE database = 'otel' AND table LIKE 'otel_metrics%' AND activeGROUP BY table ORDER BY table;
Expected: otel_metrics_gauge, otel_metrics_sum, and otel_metrics_histogram all showing rows.
This means the startup-time schema-detection probe to ClickHouse Cloud took longer than dial_timeout. Most common on Basic-tier CH services that have been idle.
Restart the container — CH is now warm: docker start otelcol-lab && sleep 10 && docker logs otelcol-lab --tail=15
The Step 3b docker run includes --restart unless-stopped so this recovers automatically. If you launched without that flag, recreate the container.
Pre-warm CH before the next launch: clickhouse client --host "$CH_HOST" --port 9440 --user default --password "$CH_PASSWORD" --secure --query "SELECT 1"
GeoCountry is empty for all rows:
Verify the dictionary loaded: SELECT status FROM system.dictionaries WHERE database = 'otel' AND name = 'geoip_country'
If NOT_LOADED or FAILED, check geoip_data has rows: SELECT count() FROM otel.geoip_data
Run SYSTEM RELOAD DICTIONARY otel.geoip_country and SYSTEM RELOAD DICTIONARY otel.geoip_city after loading the CSV — the dictionaries are created before the CSV is loaded, so they start empty and need an explicit reload (Step 2b does this for you)
Row counts in CH are much lower than ES:
Check if the OTel Collector container is running: docker ps | grep otelcol
View collector logs for errors: docker logs otelcol-lab --tail=30
Check for insert errors in the Collector logs (look for failed to send)
logs_summary_1min is empty:
The MV fires on inserts into otel.otel_logs (the Null table), not otel.otel_logs_v2
Verify data is flowing through otel.otel_logs: in a new terminal, run clickhouse client --database otel --query "SELECT count() FROM otel_logs_v2" every 30 seconds and confirm the count grows
HyperDX Search shows no data:
Confirm each HyperDX data source has Database = otel and points to the correct table (otel_logs_v2 for logs, otel_traces for traces, the five otel_metrics_* tables for OTEL Metrics)
For the Log source, the Timestamp Column must be TimestampTime (not Timestamp) — see hyperdx-guide.md for why
Check the time range selector — try "Last 24 hours"
Verify otel_logs_v2 has rows: clickhouse client --database otel --query "SELECT count() FROM otel_logs_v2"