01 Build the source environment
Stand up Elasticsearch, Kibana, Filebeat, Elastic APM Server, and the OpenTelemetry Demo as the migration baseline.
Run this module from the workshop artifact directory:
cd "$(git rev-parse --show-toplevel)/workshops/elasticsearch_migration_lab/part1"Estimated time: 20–30 minutes
Overview
Stand up a production-realistic Elasticsearch observability stack with two distinct workloads — so you have a realistic "before" state with multiple migration paths to analyze in Parts 2–3.
- Workload 1: Filebeat-based log collection — three log generators (web access, application, infrastructure) feeding Elasticsearch data streams via Filebeat and ingest pipelines.
- Workload 2: OpenTelemetry Demo (Astronomy Shop) — 16 microservices (Go, Java, .NET, Python, Rust, Node.js, PHP, Ruby) instrumented with OTel SDKs, sending traces/metrics/logs through an OTel Collector to Elastic APM Server.
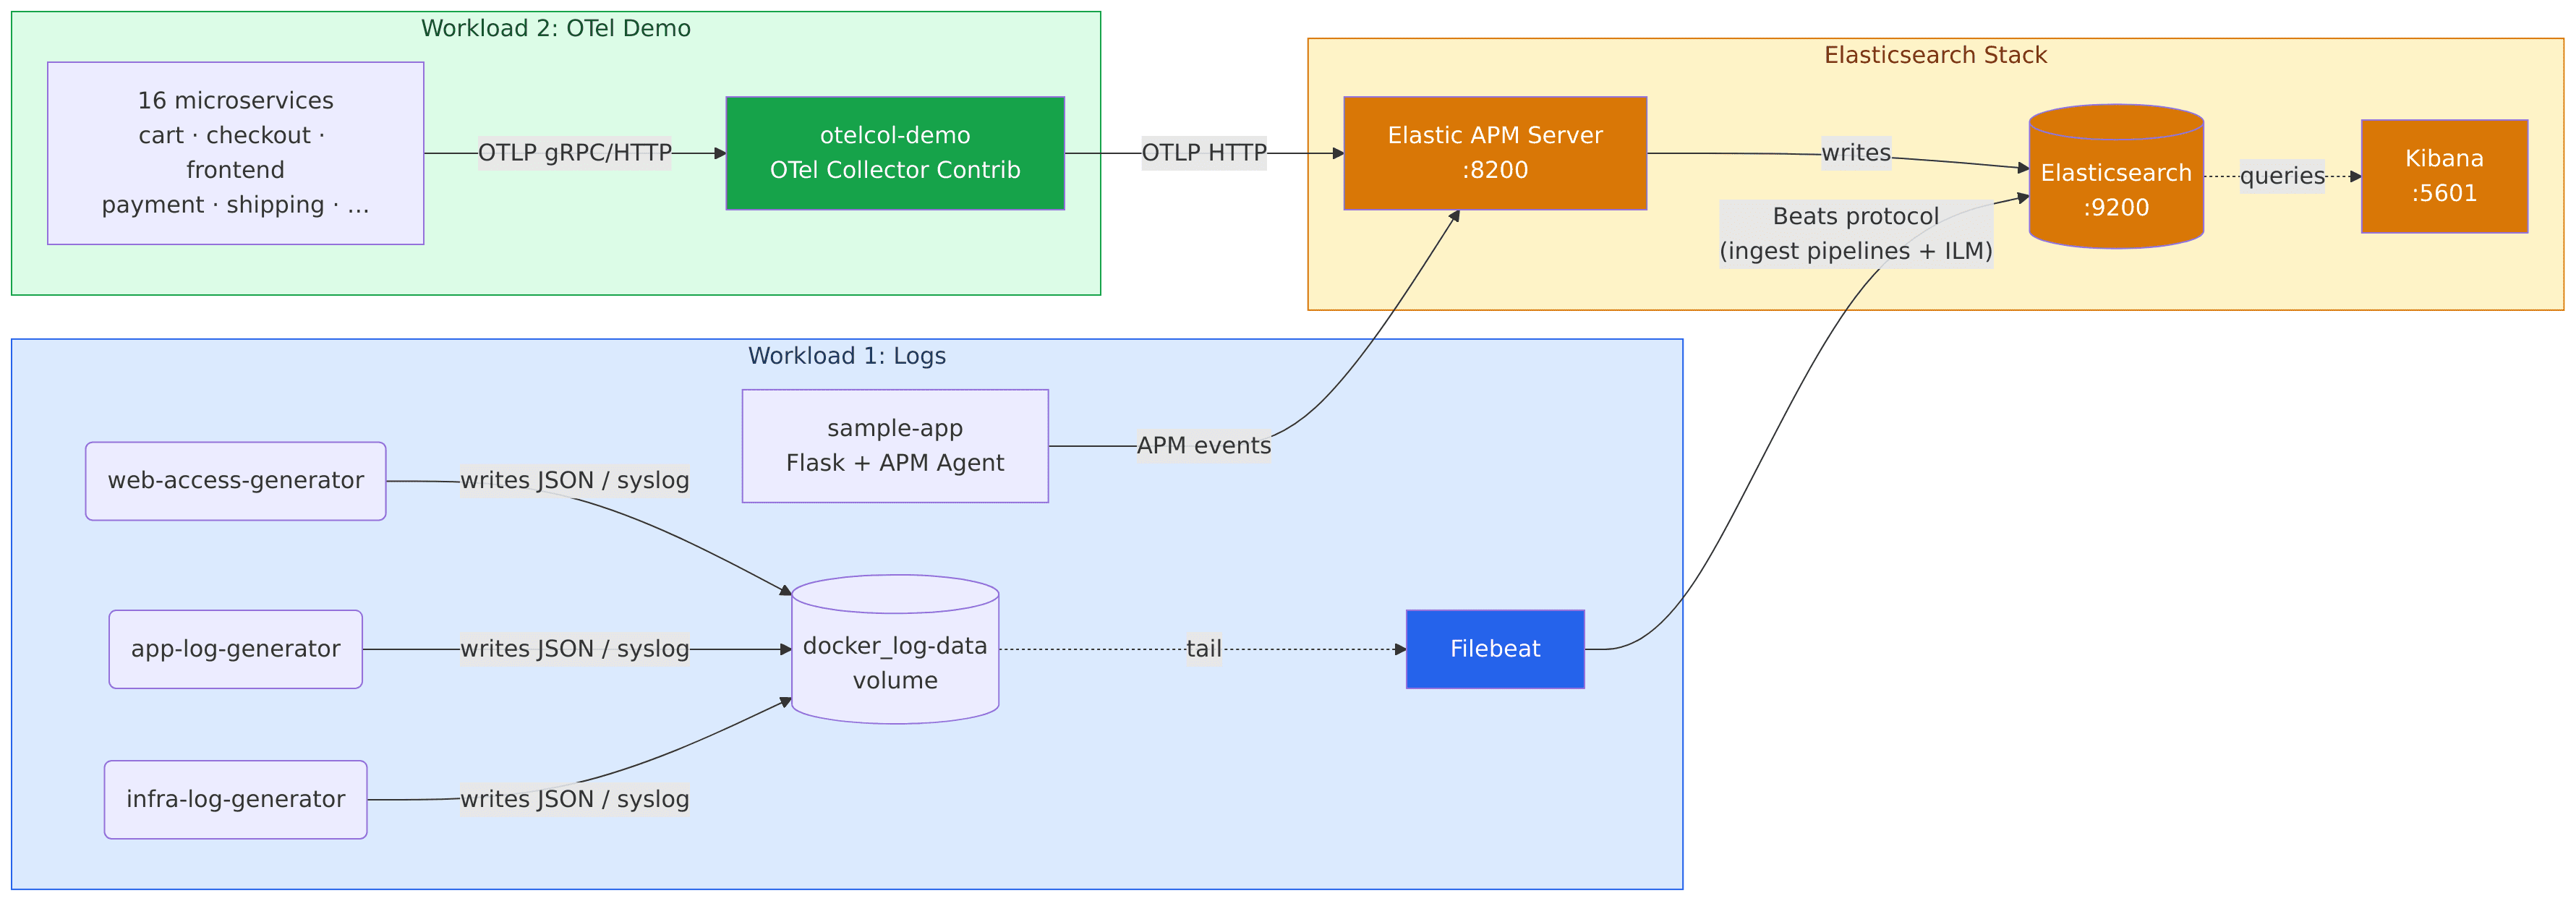
What You'll Have at the End
- Elasticsearch 8.15 running with security disabled (lab mode), receiving ~300 events/minute across 3 data streams (Workload 1)
- Kibana 8.15 with 6 pre-built dashboards: Web Traffic Overview, Application Health, Infrastructure Overview, OTel Demo — APM Traces, OTel Demo — Latency, OTel Demo — Logs
- Filebeat 8.15 collecting logs from 3 generators: web access (JSON), application (JSON), and infrastructure (syslog)
- Elastic APM Server 8.15 receiving OTLP traces from both the sample Flask app and the full OTel Demo stack
- 4 active ingest pipelines performing geoip enrichment, user-agent parsing, grok extraction, and scripted field normalization
- An ILM policy (
lab-observability-policy) managing hot/warm/delete lifecycle on all 3 data streams - OTel Demo storefront accessible at http://localhost:8090 with 15+ instrumented microservices generating continuous traffic
- All validation checks passing:
bash validation/check.sh
Prerequisites
| Requirement | Version | Notes |
|---|---|---|
| Docker Engine | ≥24.0 | Included in Docker Desktop 4.x |
| Docker Compose | ≥2.20 | Bundled with Docker Desktop; docker compose version to check |
| Available RAM | ≥16 GB (32 GB recommended) | Workload 1 ~3 GB + OTel Demo ~9 GB = ~12 GB total |
| Disk space | ≥5 GB free | For images + data volumes |
Note: For Option B (EC2), you also need Terraform ≥1.5 and an AWS account with an EC2 key pair. See Step B.1 for details.
Choosing Your Environment
Pick the option that matches your setup:
| Option | Best for | Requirements |
|---|---|---|
| Option A — Local (Docker Compose) | Mac/Linux with 16 GB RAM available, Windows WSL2 | Docker Desktop, 16 GB RAM free |
| Option B — EC2 (Terraform + Docker Compose) | AWS environments, insufficient local resources, teams sharing one instance | AWS account, Terraform ≥1.5, SSH key pair |
Both options use the same compose files and produce an identical running environment. The only difference is where the containers run.
Option A: Local (Docker Compose)
Step A.1: Set the required kernel parameter (Linux and WSL2 only)
Elasticsearch requires vm.max_map_count=262144 to avoid OOM failures. macOS users skip this step — Docker Desktop sets this internally.
Linux:
sudo sysctl -w vm.max_map_count=262144To persist across reboots:
echo "vm.max_map_count=262144" | sudo tee -a /etc/sysctl.confWSL2 (Windows):
# Run in WSL2 terminal
sudo sysctl -w vm.max_map_count=262144
Verify:
sysctl vm.max_map_countshould outputvm.max_map_count = 262144.
Step A.2: Start Workload 1 (Elasticsearch stack)
cd docker
docker compose -f docker-compose.source.yml up -d --build
Expected output (containers starting up):
[+] Running 10/10
 [+] Network docker_default       Created
 [+] Container elasticsearch      Started
 [+] Container kibana             Started
 [+] Container elastic-apm-server Started
 [+] Container es-bootstrap       Started
 [+] Container filebeat           Started
 [+] Container log-generator-web  Started
 [+] Container log-generator-app  Started
 [+] Container log-generator-infra Started
 [+] Container sample-app         Started
Allow 2–3 minutes for Elasticsearch to fully start and for the bootstrap container to finish configuring data streams, ILM policies, ingest pipelines, and Kibana dashboards.
Step A.3: Start Workload 2 (OpenTelemetry Demo)
Note: Workload 2 requires ~9 GB RAM for 16 microservices. Run this after Workload 1 is healthy.
From the same docker/ directory, add the OTel Demo services to the existing network:
docker compose -f docker-compose.source.yml -f docker-compose.otel-demo.yml up -dHow it works: Both compose files share the same Docker Compose project and network. The
otelcol-democontainer collects all signals from the demo microservices and forwards them to theelastic-apm-servercontainer started by Workload 1.
This pulls ~1.5 GB of OTel Demo images on first run. Allow 3–5 minutes for all services to become healthy.
Step A.4: Monitor the bootstrap
The es-bootstrap container creates all data streams, ILM policies, ingest pipelines, composable index templates, and imports Kibana dashboards. Watch it complete:
docker compose -f docker-compose.source.yml logs -f es-bootstrapExpected final output when the bootstrap is complete:
es-bootstrap  | ILM policy created.
es-bootstrap  | ...
es-bootstrap  | Dashboards imported.
es-bootstrap  | Bootstrap complete!
Press Ctrl+C to stop following logs.
Step A.5: Verify data is flowing
Check Elasticsearch cluster health:
curl -s http://localhost:9200/_cluster/health | python3 -m json.toolExpected: "status": "green" or "status": "yellow" (yellow is normal for a single-node cluster).
Check that all 3 data streams exist and have documents:
curl -s http://localhost:9200/_data_stream/logs-* | python3 -m json.tool | grep '"name"'Expected output:
"name": "logs-application-lab"
"name": "logs-infrastructure-lab"
"name": "logs-web_access-lab"
Check document counts across all data streams:
curl -s "http://localhost:9200/logs-*/_count" | python3 -m json.toolAfter 2–3 minutes of data generation, you should see "count" in the thousands. If it shows 0, the log generators may still be warming up — wait 1 minute and retry.
Check all 4 ingest pipelines exist:
curl -s "http://localhost:9200/_ingest/pipeline/web-access-enrichment,app-log-enrichment,infra-log-parsing,default-enrichment" \
  | python3 -m json.tool | grep -E '"web-access|app-log|infra-log|default-enrich"'
Step A.6: Access the OTel Demo storefront
Once Workload 2 is running (3–5 minutes after Step A.3), open the astronomy shop:
- Storefront: http://localhost:8090
- Load generator UI: http://localhost:8090/loadgen (shows Locust traffic stats)
- Feature flags: http://localhost:8090/feature (enable chaos engineering)
Verify: You should see the Astronomy Shop storefront. The load generator sends ~5 concurrent users automatically — you will see APM traces appear in Kibana within 1–2 minutes.
To check APM data is flowing to Elasticsearch:
curl -s "http://localhost:9200/traces-apm-*/_count" | python3 -m json.toolExpected: "count" growing above 0 within 2 minutes.
Option B: EC2 (Terraform)
The Terraform configuration in terraform/ provisions a t3.2xlarge EC2 instance (8 vCPU / 32 GB RAM), installs Docker and Docker Compose via user-data, sets vm.max_map_count=262144 automatically, clones the lab repository, and starts Workload 1 (the Elasticsearch stack). You do not need to set the kernel parameter manually. You will start Workload 2 (the OpenTelemetry Demo) yourself in Step B.4 after Workload 1 is healthy — the t3.2xlarge is sized for both.
Step B.1: Copy the variables template
cd terraform
cp terraform.tfvars.example terraform.tfvars
Open terraform.tfvars and fill in your values:
aws_region       = "us-east-1"          # AWS region to deploy in
instance_type    = "t3.2xlarge"         # 8 vCPU / 32 GB; required for dual-workload stack
ssh_key_name     = "my-key-pair"        # Name of your EC2 key pair in AWS (without .pem extension)
allowed_ssh_cidr = "0.0.0.0/0"         # Restrict to your IP for security: "x.x.x.x/32"
lab_repo_url     = "https://github.com/ClickHouse/clickhouse-partner-labs.git"
Where to find
ssh_key_name: AWS Console → EC2 → Key Pairs. The name shown there (without.pem) is what goes here.
Finding your IP: Run
curl -s ifconfig.meto get your public IP, then use<YOUR_IP>/32asallowed_ssh_cidr.
Step B.2: Initialize and apply
terraform init
terraform plan
terraform apply
Review the plan output, then type yes when prompted. Provisioning takes approximately 2–3 minutes.
Example output on success:
Apply complete! Resources: 5 added, 0 changed, 0 destroyed.

Outputs:

elasticsearch_url    = "http://54.198.12.34:9200"
instance_public_dns  = "ec2-54-198-12-34.compute-1.amazonaws.com"
instance_public_ip   = "54.198.12.34"
kibana_url           = "http://54.198.12.34:5601"
ssh_command          = "ssh -i ~/.ssh/my-key-pair.pem ec2-user@54.198.12.34"
Step B.3: Connect and watch the startup
Get the SSH command from Terraform output and connect:
# Get the exact SSH command
terraform output ssh_command

# Connect (replace with the actual output from above)
ssh -i ~/.ssh/<key-name>.pem ec2-user@<EC2_PUBLIC_IP>
Once connected, first check whether the EC2 user-data script has already started the stack for you:
cd ~/lab/partner_labs/02-elasticsearch-migration-lab/part1/docker
docker compose -f docker-compose.source.yml ps- If you see containers listed (
elasticsearch,kibana,elastic-apm-server, etc.) — user-data randocker compose up -dautomatically on first boot. Skip ahead. - If you see nothing — user-data is either still running, hasn't started yet, or failed. Wait 60–90 seconds, retry the
pscommand, and if it's still empty, start the stack yourself:
docker compose -f docker-compose.source.yml up -dThen follow the bootstrap container's logs to confirm initialization completes:
docker compose -f docker-compose.source.yml logs -f es-bootstrapExpected final line: es-bootstrap | [INFO] Bootstrap complete!
Press Ctrl-C to stop following once you see it.
Step B.4: Start Workload 2 (OpenTelemetry Demo)
Note: Workload 2 requires ~9 GB RAM for 16 microservices. Run this only after Workload 1 is healthy and the
es-bootstrapcontainer has finished (Step B.3).
From the same docker/ directory inside the SSH session, add the OTel Demo services to the existing network:
docker compose -f docker-compose.source.yml -f docker-compose.otel-demo.yml up -dHow it works: Both compose files share the same Docker Compose project and network. The
otelcol-democontainer collects all signals from the demo microservices and forwards them to theelastic-apm-servercontainer started by Workload 1.
This pulls ~1.5 GB of OTel Demo images on first run. Allow 3–5 minutes for all services to become healthy.
Step B.5: Verify from the EC2 instance
Run these commands from inside the SSH session using localhost. From outside the EC2 instance, the security group restricts ports 9200 and 5601 to your allowed CIDR only — they are not open to the broader internet:
# Cluster health
curl -s http://localhost:9200/_cluster/health | python3 -m json.tool

# Data streams
curl -s http://localhost:9200/_data_stream/logs-* | python3 -m json.tool | grep '"name"'

# Document counts
curl -s "http://localhost:9200/logs-*/_count" | python3 -m json.tool
Confirm Workload 2 containers are running and APM traces are flowing:
# OTel demo containers (should list 16+ services like frontend, cartservice, otelcol-demo, etc.)
docker compose -f docker-compose.source.yml -f docker-compose.otel-demo.yml ps

# APM trace count (should be > 0 and growing 2 minutes after Workload 2 starts)
curl -s "http://localhost:9200/traces-apm-*/_count" | python3 -m json.tool
You can also run the ES verification from your laptop using the public IP from terraform output:
curl -s http://<EC2_PUBLIC_IP>:9200/_cluster/health | python3 -m json.toolNote on the OTel storefront UI: The Astronomy Shop UI (port 8090) is not exposed in the default security group. To access it from your laptop, either open port 8090 in
terraform/main.tf(and re-apply), or use SSH port-forwarding:ssh -i ~/.ssh/<key-name>.pem -L 8090:localhost:8090 ec2-user@<EC2_PUBLIC_IP>, then visit http://localhost:8090.
Step 1.6: Open Kibana (both options)
Accessing Kibana
- Local: http://localhost:5601
- EC2:
http://<EC2_PUBLIC_IP>:5601(use the IP fromterraform output kibana_url)
Kibana may show a loading screen for 30–60 seconds on first access while it initializes.
Navigating to the dashboards
- In the Kibana left sidebar, click Analytics → Dashboards
- You should see 4 dashboards:
- Web Traffic Overview — request rates, status codes, geographic distribution
- Application Health — log volume by severity, error tracking
- Infrastructure Overview — syslog volume by host, top processes
- OTel Demo — APM Traces — trace volume and top services (appears after Workload 2 starts)
- Click Web Traffic Overview and set the time range to Last 15 minutes (top-right)
Verify: The dashboard should show live data with charts updating. If all panels are empty, wait 2 minutes for the log generators to produce enough data, then refresh.
To view APM traces from the OTel Demo in Kibana, navigate to Observability → APM → Services after Workload 2 is running.
Step 1.7: Run the validation script
Run the validation script to confirm all Part 1 components are healthy before proceeding.
Local:
bash validation/check.shEC2 (from your laptop):
bash validation/check.sh http://<EC2_IP>:9200 http://<EC2_IP>:5601EC2 (from inside the SSH session):
bash ~/lab/partner_labs/02-elasticsearch-migration-lab/part1/validation/check.shExpected output when all checks pass (run ~5 minutes after starting both workloads):
============================================
 Part 1 Validation — Source Environment
 ES:      http://localhost:9200
 Kibana:  http://localhost:5601
 OTelCol: http://localhost:8888
============================================

[PASS] Elasticsearch is reachable
[PASS] Data streams exist (3 found: logs-web_access-lab, logs-application-lab, logs-infrastructure-lab)
[PASS] ILM policy 'lab-observability-policy' exists
[PASS] Ingest pipeline 'web-access-enrichment' exists
[PASS] Ingest pipeline 'app-log-enrichment' exists
[PASS] Ingest pipeline 'infra-log-parsing' exists
[PASS] Ingest pipeline 'default-enrichment' exists
[PASS] Data stream 'logs-web_access-lab' has data (3,241 docs)
[PASS] Data stream 'logs-application-lab' has data (1,876 docs)
[PASS] Data stream 'logs-infrastructure-lab' has data (2,104 docs)
[PASS] GeoIP enrichment working (country: United States)
[PASS] Kibana is reachable
[PASS] Kibana dashboards imported (4 found)
[PASS] OTel Collector (otelcol-demo) is reachable
[PASS] APM traces indexed from OTel Demo (5,832 spans)
[PASS] OTel Demo storefront reachable at http://localhost:8090

============================================
 Results: 16 passed, 0 failed, 0 skipped
============================================
Note: Checks 14–16 (OTel Demo) show
[SKIP]until Workload 2 is fully started. Run the validation again after 5 minutes.
Troubleshooting
All commands below assume you are in
part1/docker/(the same working directory used by the steps above). If you've changed directory, runcd part1/dockerfirst.
1. Elasticsearch OOM / vm.max_map_count too low
Symptom: The elasticsearch container exits immediately or repeatedly restarts. docker compose logs elasticsearch shows:
max virtual memory areas vm.max_map_count [65530] is too low, increase to at least [262144]Fix (Linux / WSL2):
sudo sysctl -w vm.max_map_count=262144
# Then restart the container:
docker compose -f docker-compose.source.yml restart elasticsearch
Fix (macOS): This error should not occur on macOS — Docker Desktop sets this automatically. If you see it, restart Docker Desktop.
2. Bootstrap fails — Elasticsearch not ready in time
Symptom: The es-bootstrap container exits with an error like Connection refused or curl: (7) Failed to connect. This happens if Elasticsearch is slow to start (common on machines under memory pressure).
Fix: Restart just the bootstrap container after Elasticsearch is healthy:
# Wait for Elasticsearch to be fully up
until curl -sf http://localhost:9200/_cluster/health > /dev/null 2>&1; do
  echo "Waiting for Elasticsearch..."; sleep 5
done

# Re-run bootstrap
docker compose -f docker-compose.source.yml restart es-bootstrap

# Watch it complete
docker compose -f docker-compose.source.yml logs -f es-bootstrap
3. GeoIP pipeline shows MISSING country
Symptom: The validation script reports [FAIL] GeoIP enrichment not working — geo.country_name missing from web access docs, or a manual spot-check shows "country_name": null.
Cause: Elasticsearch downloads the GeoIP database on first startup. This takes 1–2 minutes. Documents indexed before the database is available are not enriched retroactively.
Fix: Wait 2 minutes, then re-run the validation:
bash validation/check.shYou can confirm the database has loaded:
curl -s "http://localhost:9200/_ingest/geoip/stats" | python3 -m json.tool | grep '"databases_count"'Expected: "databases_count": 1 (or more). If it shows 0, wait another minute and retry.
Checkpoint
Before proceeding to Part 2, verify all of the following:
Workload 1 (Elasticsearch):
- Elasticsearch is healthy:
curl http://localhost:9200/_cluster/health - 3 data streams exist:
curl http://localhost:9200/_data_stream/logs-* - ILM policy is attached:
curl http://localhost:9200/_ilm/policy/lab-observability-policy - Kibana shows dashboards with live data at http://localhost:5601
Workload 2 (OTel Demo):
- Storefront loads at http://localhost:8090
- APM traces appear in Kibana: Observability → APM → Services (15+ services visible)
-
curl http://localhost:9200/traces-apm-*/_countreturnscount > 0
Both:
- All validation checks pass:
bash validation/check.sh