01 Why is this slow?
The same question asked of BigQuery and, later, of ClickHouse -- two pre-measured answers, no explanation yet, and a straight statement of where BigQuery genuinely wins.
One dataset, two places
This workshop moves the GA4 obfuscated sample e-commerce dataset -- the same one behind BigQuery's own public-data tutorials -- from BigQuery into ClickHouse. Before you touch either system, look at how BigQuery itself performs against the public copy of this data.
Both queries below run against bigquery-public-data.ga4_obfuscated_sample_ecommerce, the
untouched public dataset. You do not need a Google Cloud project to see this: querying
BigQuery, even a public dataset, bills to whoever's project runs the query, so your
instructor ran both queries live and the screenshots below are the console's own job
statistics, not just the numbers typed out below them. The copy you will use for the rest of
this workshop lives in a GCS bucket and is the same data shifted five years forward in time --
module 02 covers that shift and why it is safe to ignore for now. user_pseudo_id is not
shifted, so the same user exists identically in both copies.
The single-user lookup
SELECT
  TIMESTAMP_MICROS(event_timestamp) AS event_time,
  event_name,
  geo.country                       AS geo_country
FROM `bigquery-public-data.ga4_obfuscated_sample_ecommerce.events_*`
WHERE user_pseudo_id = '3272961.4196485002'
ORDER BY event_time DESC
LIMIT 20;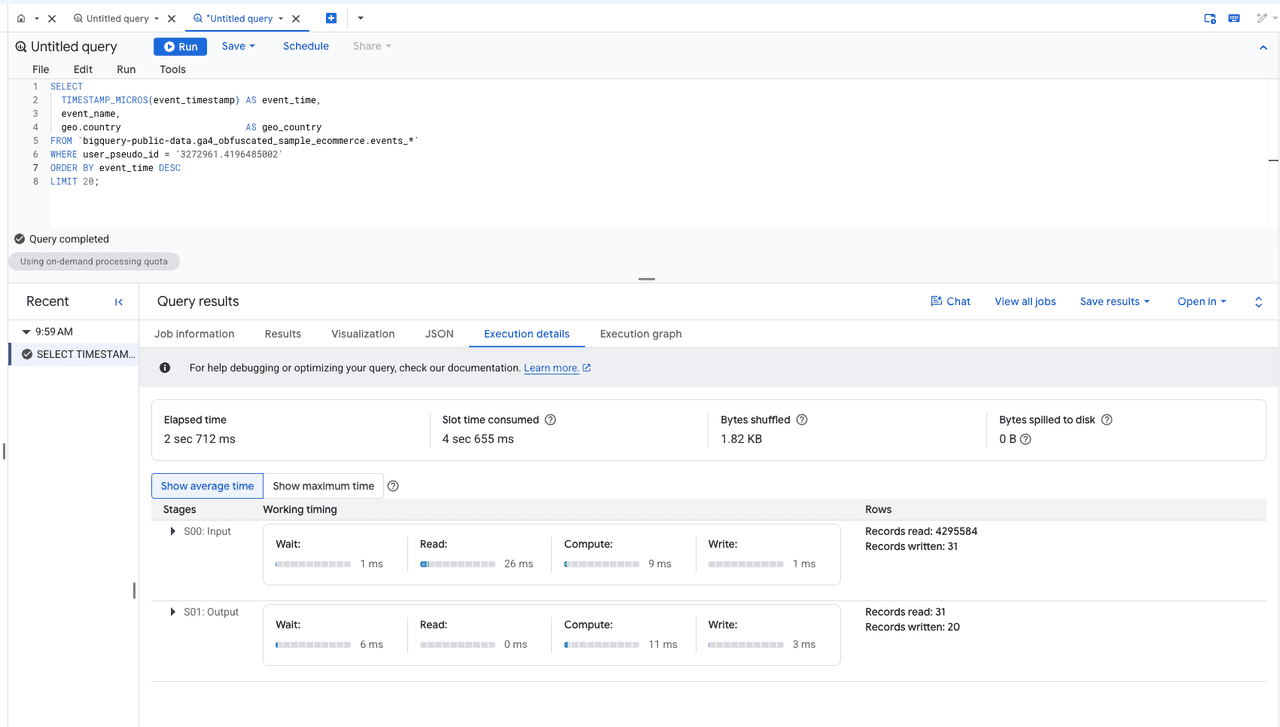
BigQuery's own Execution details for the query above -- elapsed time and, stage by stage, how many records it read to answer it -- from a live run, not typed in from memory.
This is about as favorable a query as BigQuery ever sees: one user, twenty rows, a LIMIT.
The figures below are the median of three runs, read from BigQuery's own job statistics.
The one-day dashboard aggregate
SELECT
  TIMESTAMP_TRUNC(TIMESTAMP_MICROS(event_timestamp), MINUTE) AS minute,
  device.category                                            AS device_category,
  geo.country                                                AS geo_country,
  COUNTIF(event_name = 'view_item')                          AS views,
  COUNTIF(event_name = 'add_to_cart')                        AS carts,
  COUNTIF(event_name = 'begin_checkout')                     AS checkouts,
  COUNTIF(event_name = 'purchase')                           AS purchases,
  APPROX_COUNT_DISTINCT(user_pseudo_id)                      AS users,
  ROUND(SAFE_DIVIDE(COUNTIF(event_name = 'add_to_cart'), COUNTIF(event_name = 'view_item')), 4) AS cart_rate
FROM `bigquery-public-data.ga4_obfuscated_sample_ecommerce.events_*`
WHERE _TABLE_SUFFIX = '20201201'
GROUP BY minute, device_category, geo_country
ORDER BY minute DESC, device_category, geo_country;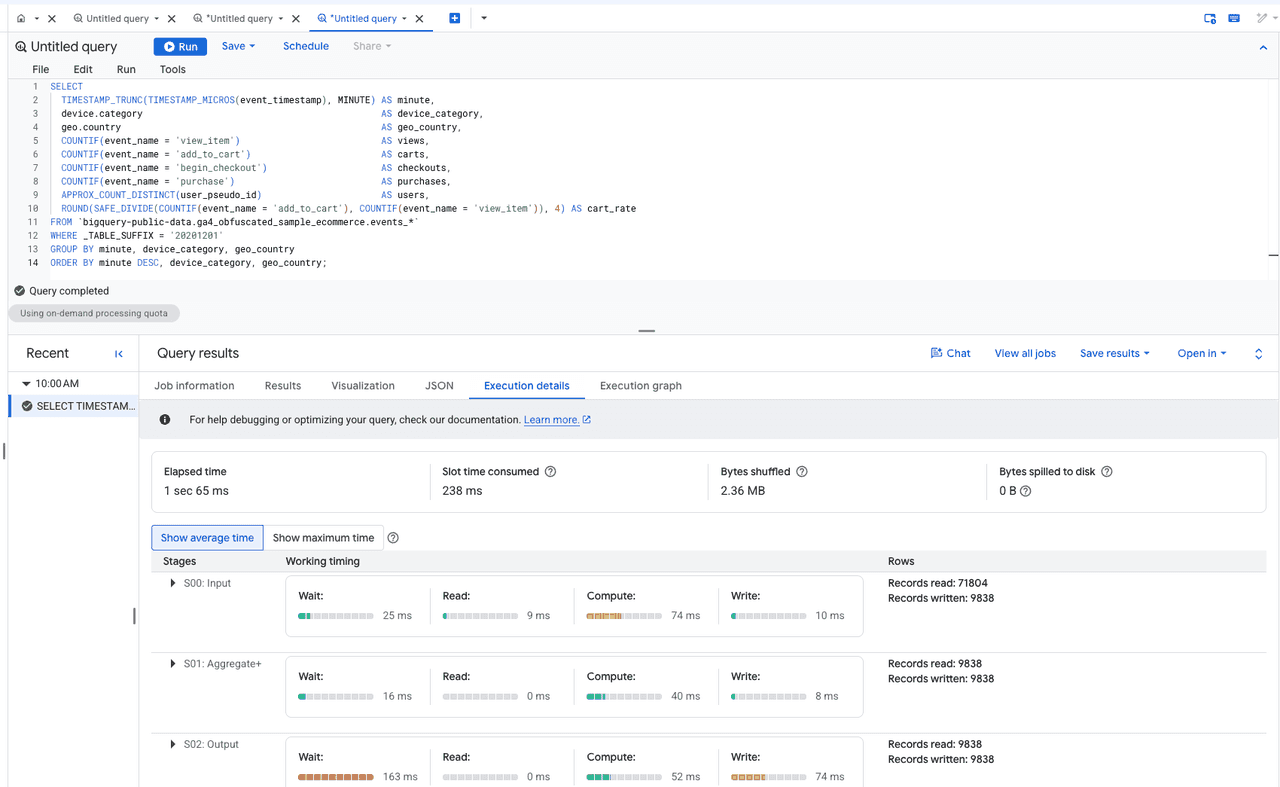
BigQuery's own Execution details for the query above, from the same live run.
This is a per-minute conversion funnel -- views, cart adds, checkouts, purchases, distinct
users -- restricted to one calendar day, which is exactly the shape of query a live dashboard
sends on every page load. BigQuery's daily-table partitioning (_TABLE_SUFFIX) prunes hard
here -- median of three runs:
Same question, two answers
BigQuery scanned 4,455,256 bytes on the one-day dashboard query above -- about 4.46 megabytes, effectively nothing for a warehouse built for petabytes -- because its daily-table pruning worked exactly as designed. It still took 0.98 seconds.
Later in this workshop, the identical question -- the same one-day funnel, grouped the same way, with the same funnel counts -- gets asked of the same rows sitting in a ClickHouse table. It answers in 52 milliseconds, on a query BigQuery had already pruned down to a few megabytes:
That is the puzzle, stated exactly: two systems, the same question, and BigQuery had already done the part that is supposed to make a query fast -- reading almost nothing -- and still lost by roughly 19 times. If the gap were about bytes scanned, it should not exist at all. This module does not explain what it is actually about. Hold both numbers -- 0.98 seconds and 52 milliseconds -- through the next two modules, which put the same data in front of you twice more before this workshop starts explaining why.
Where BigQuery genuinely wins
None of this is an argument that BigQuery is badly built. It solves a problem ClickHouse does not: point it at petabytes nobody has modeled, ask a question nobody anticipated, and it answers -- no schema commitment ahead of time, no cluster to size, no service running between questions. Zero operational surface is a real advantage for ad-hoc, exploratory analytics over data nobody has shaped yet. This workshop is about a different problem: a dashboard with real users hitting it concurrently, which is a shape BigQuery's pricing and concurrency model were not built to serve cheaply.
Done when
You can restate the puzzle in one sentence: the same one-day funnel question, asked of the same rows, took 0.98 seconds in BigQuery after it had already pruned its scan down to 4.46 megabytes, and 52 milliseconds in ClickHouse -- and that gap is not explained by how much data either system read. Continue to 02 Query it in place.